
5 min readMyTradingBuddy
Volume Profile vs Market Profile: Volume or Time?
Compare volume profile vs market profile, understand volume and TPO points of control, and keep session settings consistent when reviewing levels.
Share this
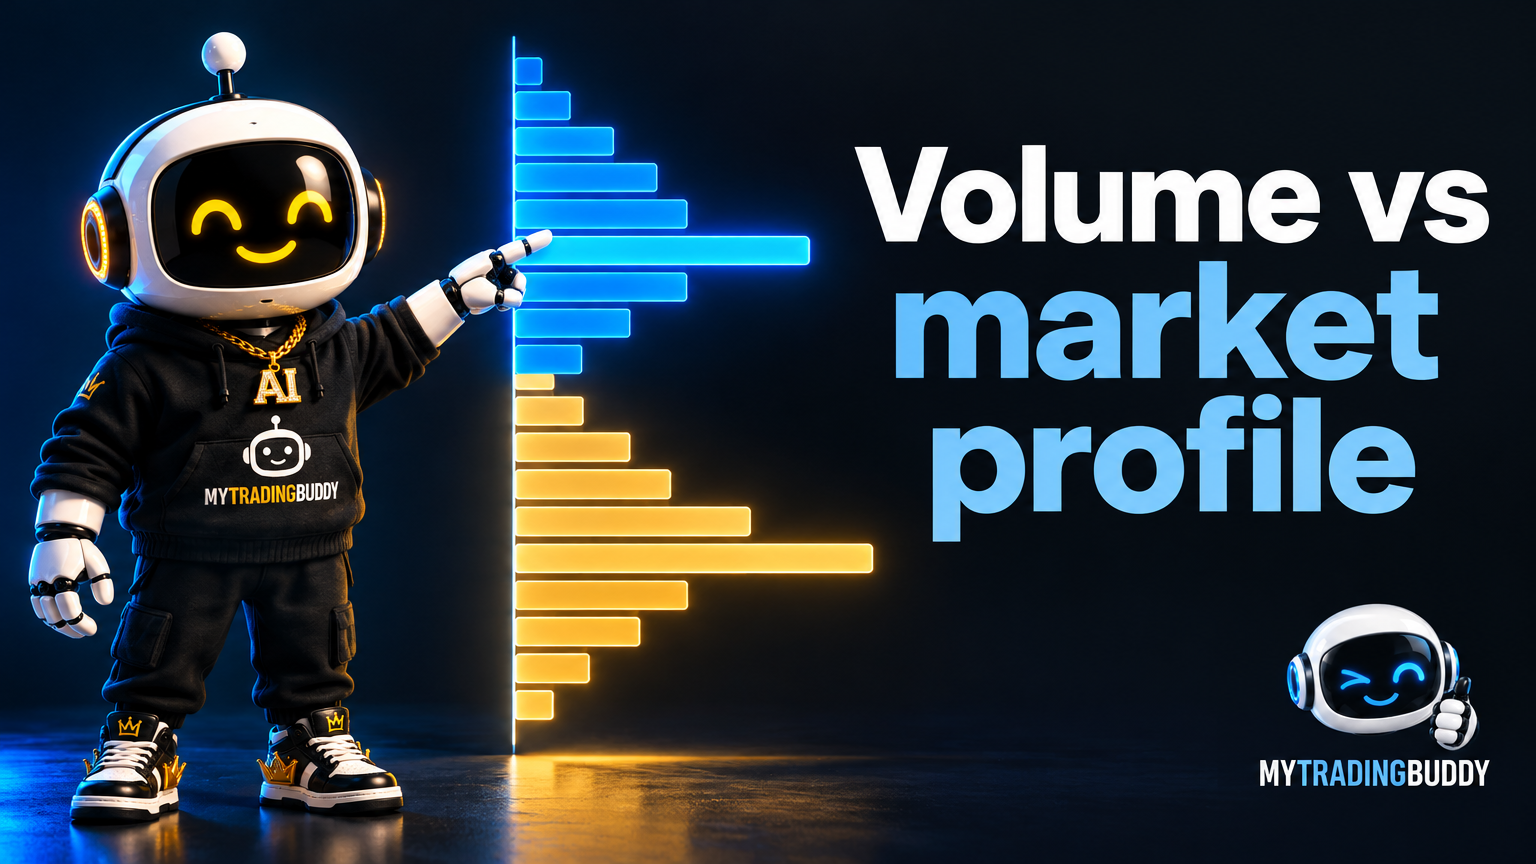
Volume profile vs market profile is a comparison of what each distribution counts. A volume profile organizes volume by price level over a chosen range. A market profile, commonly displayed as TPO, organizes time-price opportunities: whether a price was visited during defined time blocks.
Both can help describe where activity occurred. Neither proves where price must go next. Their usefulness depends on the selected period, session, price-row settings and underlying data, so a comparison starts with those inputs.
Volume profile vs market profile at a glance
TradingView's volume-profile concepts describe activity distributed across price levels. Its TPO indicator documentation describes blocks of time represented at the price rows visited during those blocks.
| Question | Volume profile | Market profile / TPO |
|---|---|---|
| What is grouped by price? | Volume from the selected data | Time-block visits |
| What affects the distribution? | Range, session, row size and volume data | Range, session, row size and block duration |
| What does a prominent row mean? | Relatively high recorded volume | Many time-block opportunities |
| Does it guarantee a reaction? | No | No |
The phrase “time at price” is convenient shorthand for TPO, but it should not be confused with a precise stopwatch measuring every second at an exact price.
What a volume profile can and cannot tell you
A high-volume row identifies where more of the selected dataset's volume was attributed. A low-volume area identifies relatively less. Both descriptions are conditional on the range and settings you chose.
They do not directly reveal every participant's intention, future orders or willingness to defend a level. A large amount of past trading at a price does not create an obligation for the next visit to bounce.
Check what “volume” means for the instrument and feed. Actual exchange volume and other activity measures should not be treated as interchangeable without reading the platform's documentation.
We use the profile as a description to compare with price behavior. For example, you can ask whether a proposed level sits near a concentration of activity, while keeping the actual entry and invalidation conditions in the trading plan.
What TPO adds to the comparison
A TPO profile records whether price rows were visited in successive time blocks. A row can therefore accumulate many opportunities even when its volume is not the largest.
This makes a different question visible: how broadly was a price area revisited across the selected time blocks? It is related to time distribution rather than simply the amount traded.
TradingView's TPO chart explanation describes the block and period settings. Changing either can change the profile's appearance, so keep them in the screenshot or accompanying notes when comparing sessions.
Do not translate a wide TPO row directly into a guaranteed support level. The observation needs a separate hypothesis about current price behavior and a clear condition that could disprove it.
Point of control trading needs a precise definition
A point of control is a prominent reference level within a profile, but the metric matters. A volume-based point of control concerns the greatest volume row; a TPO-based point of control concerns the time-opportunity distribution.
Consider a deliberately simplified example. Price row 100.00 has 1,800 units of recorded volume and appears in two time blocks. Row 100.25 has 900 units and appears in four blocks. The rows emphasized by the two measures can differ.
That is not necessarily an error. The two tools answered different questions using the same hypothetical period. Platform rules for row aggregation and ties can add further differences.
When someone says “price is at POC,” ask which profile, which period, which session and which row settings. Without that information, the statement is too incomplete to reproduce or test.
Match the settings before comparing profiles
Keep the instrument, expiry, data source, session and date range consistent. Then record the volume-profile row configuration and the TPO block duration.
If one chart includes an overnight session and another only regular hours, their distributions do not describe the same activity. If one uses a continuous futures series and another a specific expiry, check the contract-adjustment assumptions as well.
The guide to NQ candle close times explains why clocks and session definitions belong in chart analysis. The same discipline applies to profiles.
Also distinguish a completed profile from one still developing. The current session's point of control can move as new activity is added. Do not review an earlier decision using the final distribution as though it had already existed at the time.
Turn a profile observation into a testable question
Start with a descriptive sentence: “The selected range contains relatively high volume around this row.” Then write what you expect to observe if that area remains relevant and what would contradict the idea.
Our support and resistance guide can help with that second step. A profile feature can support the explanation of a zone, but the zone still needs a defined role in the plan.
Save the pre-decision profile. After the session, compare the observation with what actually occurred without moving the range to make the original claim look better.
A single attractive reaction is not proof of an edge. If you want to evaluate a repeatable idea, define the selection criteria before reviewing a group of examples and retain the failures as well as the clean-looking charts.
A profile-review checklist
Before acting on a profile-based interpretation, check:
- The exact instrument and data source.
- The start, end and session of the profile.
- The row size and any TPO block setting.
- Whether the profile is completed or developing.
- Which metric defines the marked point of control.
- The separate entry and invalidation conditions.
Remove labels that do not help answer the question. A chart with both profile types, several session overlays and many horizontal lines can become difficult to read, even when every indicator is technically working.
Our guide to what Ai chart analysis checks explains why readable context matters. State the profile settings with your question so the explanation does not depend on missing information.
For another view of that chart context, compare MyTradingBuddy Ai plans. Use the reasoning as something to evaluate against the data and your plan, not as proof that a profile level will hold.