
8 min readMyTradingBuddy
Prop Firm Payout Analytics: How to Read a Payout Tracker
Read prop firm payout analytics with context: compare totals, counts, median amounts, payout timing and tracker coverage using clear worked examples.
Share this
Prop firm payout analytics helps you interpret recorded payments: how much was tracked, how often payments appeared, how large they were and how long particular stages took. The useful comparison starts with the dataset's coverage and definitions.
A bigger total does not tell you your chance of receiving a payout. A faster median does not tell you which part of the payment journey was timed. Before choosing a firm, make those numbers answer a specific question.
This guide provides a method for reading a prop firm payouts tracker. Sources were checked on October 8, 2026. Every numerical worked example below is fictional.
Start with the question you want answered
A tracker is easier to use when you decide what you need to know before sorting the table.
| Your question | Useful evidence | Missing context to look for |
|---|---|---|
| Has payment activity been recorded recently? | Recent records and latest dataset update | Coverage gaps or a paused feed |
| How much activity does the tracker observe? | Total amount and number of payments | Included methods, period and firm size |
| What does a typical recorded payment look like? | Median, distribution and payment count | Whether repeat recipients dominate |
| How long might the process take? | Timing records with defined endpoints | Firm review, withdrawal and receiving-account stages |
| Will these account rules work for me? | The firm's current terms for your plan | Eligibility, limits, fees and restrictions |
The last question needs the firm's rules. A payment leaderboard cannot replace them.
For example, PropFirmMatch's payout page presents tracked totals, counts, largest payments, average amounts and median payout times. Those fields are useful inputs. They become more useful when you write down what each one measures.
The prop firm payout analytics metrics worth checking
Total recorded payouts
This is the amount counted within the selected dataset and period.
Ask whether the figure covers a single payment method, several processors or a wider submission process. Also ask when tracking began. Two all-time totals may cover different lengths of history.
A larger observed total could reflect more payment records, larger individual payments or broader coverage. The total alone cannot identify which explanation applies.
Number of payouts
Find out what one counted item means. It may be a payment record or transaction; it should not automatically be read as one unique trader.
For your own research notes, keep “payment count” and “distinct recipients” in separate columns. If the source does not publish recipient information, label it unknown.
One trader receiving several payments can increase the count without adding several new traders.
Average payout size
The arithmetic average is the recorded amount divided by the number of included payments, provided both fields cover the same records.
An average is useful for describing that set. Large payments can pull it upward, so compare it with the median and distribution when available.
Do not divide an all-time total by a monthly count. A calculator will give you an answer, but it will not describe a coherent group of payments.
Median payout size and the largest payment
The median is the middle amount after sorting the payments. With an even number of records, it is the average of the two middle amounts.
The maximum answers a different question: what was the largest recorded payment in the group? It tells you about an extreme, not the amount a new account holder should expect.
If a tracker publishes only the average and maximum, do not invent a median.
Payout time
Write down the two events used to calculate elapsed time. Possibilities include request-to-approval, approval-to-processor credit, or withdrawal-to-receipt.
These measurements cannot be ranked as if they were interchangeable. Also check whether a published estimate uses business days or calendar time, and whether the data includes payments still awaiting completion.
For your own payment, record each timestamp and timezone. That lets you locate a delay instead of arguing about one ambiguous “payout time.”
Recent activity and change
Compare equal-length periods using the same coverage and cutoff rules. A completed seven-day period should not be compared with the first two days of the next week as if both were full weeks.
Record both the percentage change and the underlying amounts. A large percentage on a small starting value can sound more substantial than the underlying change.
Worked example: the average can hide the middle
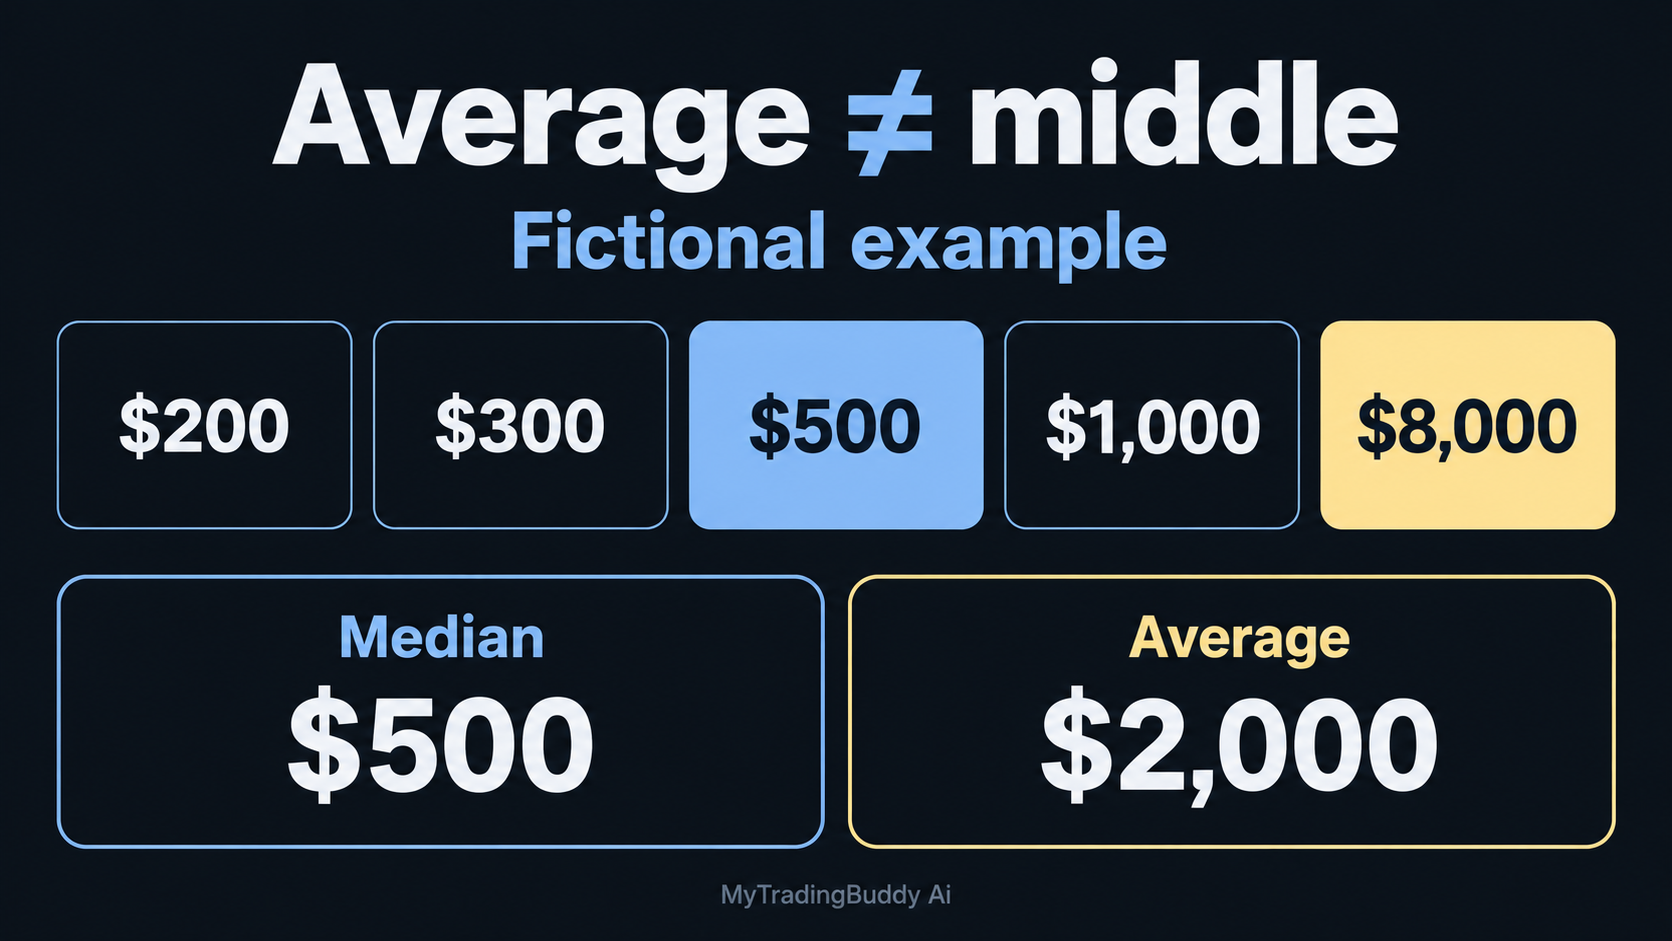
Imagine a dataset with five payouts:
$200, $300, $500, $1,000 and $8,000.
These are invented amounts, not a firm's results.
| Measure | Calculation | Result |
|---|---|---|
| Total | 200 + 300 + 500 + 1,000 + 8,000 | $10,000 |
| Count | Five records | 5 |
| Average | $10,000 divided by 5 | $2,000 |
| Median | Middle amount in the sorted list | $500 |
| Largest payout | Highest amount | $8,000 |
| Share from the largest payment | $8,000 divided by $10,000 | 80% |
The average is $2,000 even though four of the five payments are below $2,000. The largest payment accounts for most of the total.
A headline using the average would therefore leave out a useful part of the story. The median and concentration show why the records look the way they do.
Neither statistic reveals how many people bought an evaluation, how many requests were declined or what another trader will receive. Those questions need different records.
Compare firms using the same measurement
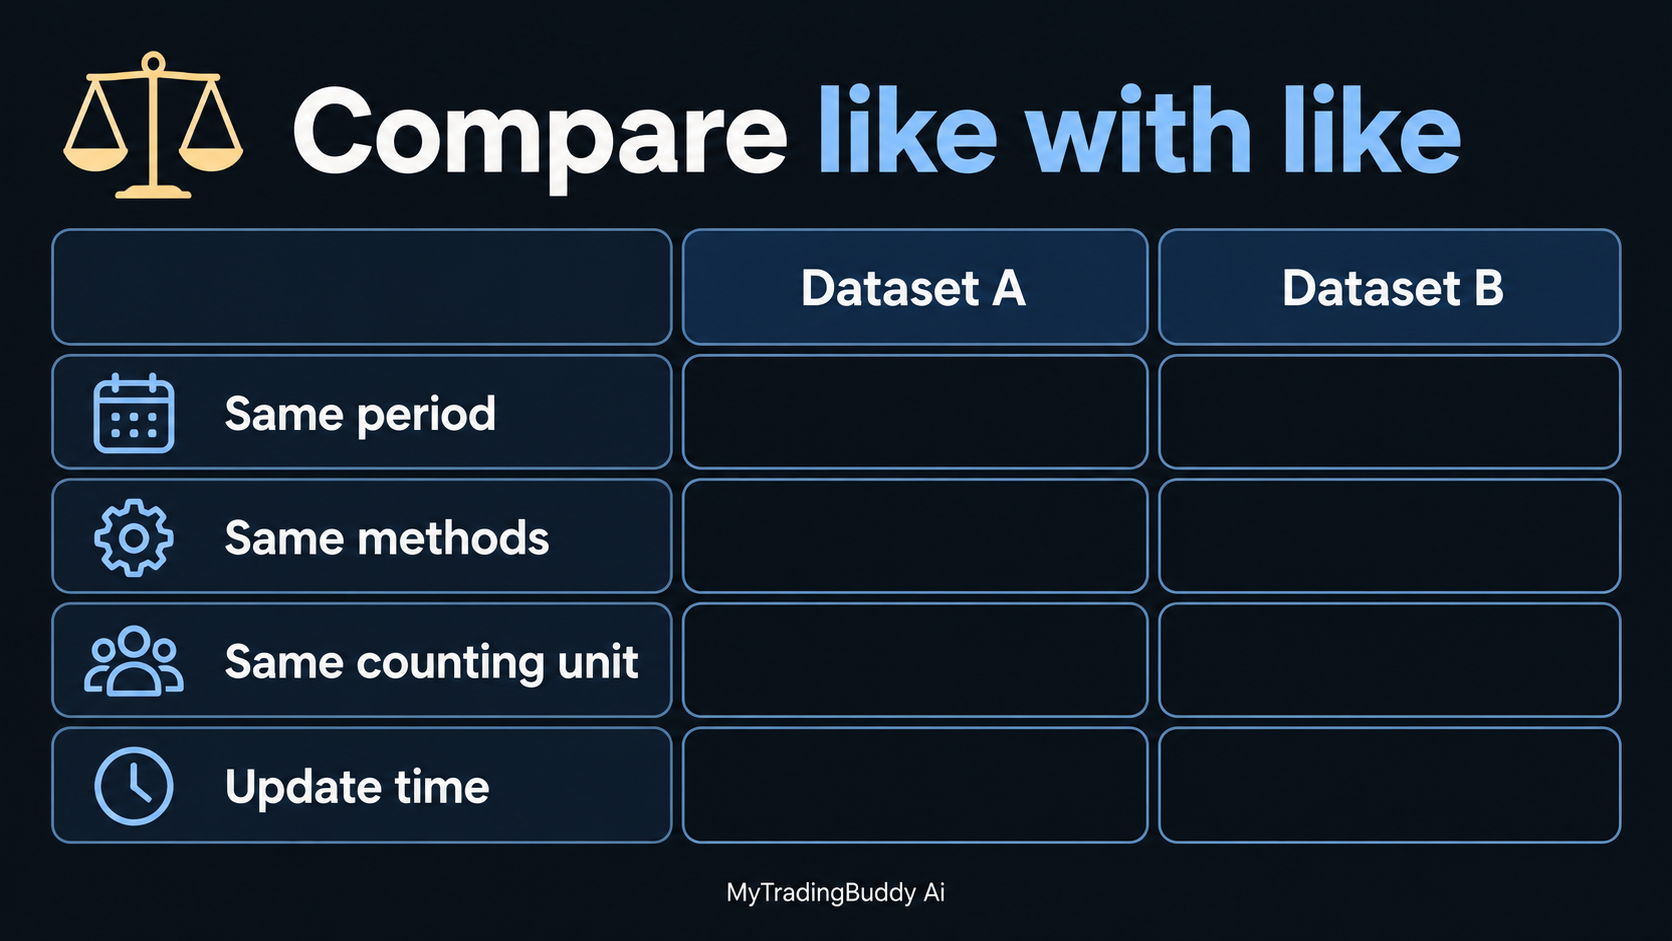
Consider two fictional firms observed over the same completed 30-day period.
| Measure | Firm A | Firm B |
|---|---|---|
| Recorded payout amount | $120,000 | $120,000 |
| Counted payments | 120 | 40 |
| Average recorded payment | $1,000 | $3,000 |
| Published timing measure | 3 hours, approval to payment release | 24 hours, request to final receipt |
Both totals are the same. Firm B's average is larger because it has fewer counted payments. That does not establish that its accounts are easier to trade or that its customers are more likely to receive a payment.
The timing comparison is also incomplete: the clocks start and stop at different events. You would need comparable timestamps before calling either process faster.
Our suggested comparison order is:
- Match the period and cutoff.
- Match the payment methods and dataset scope.
- Check the meaning of each counted record.
- Compare the distribution, not only the biggest number.
- Read the rules for the account you would actually buy.
If any of those inputs is unavailable, record the limitation beside the result. Avoid turning “unknown” into a zero.
Understand what each tracker leaves out
A Rise prop firm tracker or prop firm crypto payout tracker usually focuses attention on a particular payment route. The coverage statement determines what you can infer from it.
Payout Junction's methodology says it matches counted payments to public blockchain transactions and leaves out bank, card and untracked routes. That describes its observed dataset, not a firm's complete payment history.
PropFirmMatch's transparency page distinguishes tracked payout evidence from trader reviews and other ranking signals. Our reading is that a “verified” label should be interpreted within the service's stated method. It is not a universal measurement shared by every site.
For a tool-by-tool discussion, use our Payout Junction vs PropFirmMatch comparison. This article's purpose is to help you analyze the resulting numbers.
Fresh page, old data
When checked on October 8, 2026, TradingPilot's tracker disclosed a paused Rise feed and a June 20 data cutoff. The page explained that its empty recent views reflected a data gap rather than proof that firms had stopped paying.
That is a useful example of why the dataset timestamp matters. A current copyright year or a page that loads today does not establish current payout coverage.
Real transfer, uncertain classification
A public transfer proves something about movement on a network. Deciding whether it belongs in a trader-payout dataset also requires correct attribution and classification.
Payout Junction's site notice acknowledges that firm-associated wallets may also be used for operational expenses. Ask how the tracker identifies payout records and handles other transfers. Do not independently add every outgoing wallet transaction and label the sum trader payouts.
Many payments, unknown probability
A payment count lacks the denominator needed to estimate a trader's chance of receiving a payout.
You would need a clearly defined group of accounts and outcomes observed over a suitable period. Payments can repeat for one account, while other accounts may still be active. Without that context, dividing payment records by a loosely related account total creates a misleading percentage.
Read a falling total as a research prompt
In another fictional example, tracked payments fall from $60,000 in one complete week to $45,000 in the next.
The change is:
($45,000 − $60,000) ÷ $60,000 = −25%.
That calculation is correct. The cause is still unknown.
Our follow-up questions would be whether the tracker changed coverage, whether a payment batch moved between periods, whether the firm changed methods, and whether current account holders report a specific processing issue.
Check the evidence for each explanation. Do not choose the most alarming one because the chart is red. Equally, a rising total should not end your due diligence.
The wider checks belong in our prop firm red-flags guide: payout data is one part of the decision.
Build a short research note before buying an account
You do not need a complicated scoring model. We suggest recording one comparable snapshot:
- Firm and exact account plan.
- Tracker, source link and dataset update time.
- Observation period and included payment methods.
- Total, count, average, median if available, and largest record.
- Definition of any payout-time metric.
- Missing coverage, unresolved questions and the relevant firm-rule links.
Add a plain-English conclusion such as: “Recent payment records are visible, but this source does not include bank transfers and does not publish a comparable request-to-receipt time.”
That is more informative than assigning an unexplained score out of ten.
If you already have a request under dispute, move from firm research to your actual documents. Our payout-denial guide covers that next step.
Use the research to support a trading process
Payout analytics helps you ask better questions about payment evidence. Account rules tell you what applies to your plan. Your chart review is another practical checkpoint before an entry.
MyTradingBuddy Ai lets you review chart screenshots across timeframes and check a setup against your playbook. Keep the firm's current limits beside that analysis, verify the output and make your own trading decision.
Get started with MyTradingBuddy Ai when you are ready to review your next setup.